SQL Case Studies
A growing set of SQL projects, each starting from a business question and ending in a Power BI report.
- Role
- Sole builder
- Stack
- SQL, Power BI
- Status
- Two complete
About the Projects
The other two projects each take a broad topic from many angles on a live site. These are smaller and more focused: a way to put my SQL and Power BI training to work on the kind of business questions a hiring manager would actually ask, and to show the analysis and visuals I can bring to real-world questions across a range of industries.
So the emphasis isn’t on query syntax but on the work around it: choosing what to measure, deciding what the data can’t tell you, and landing on a defensible answer. Each project below starts from a business question and ends in a Power BI report, with the SQL, the database, and the report file on GitHub so every query can be re-run.
Project 01 · Video Game Sales Data
Which genres, ratings, and titles actually drive video game sales?
A public Kaggle dataset of video game titles released between 1980 and 2017, with genre, platform, critic ratings, and unit sales broken out by region. It answers three questions a publisher’s planning team would ask before greenlighting a title: which genre leads in each region, whether ratings translate into sales, and whether a standalone title can compete with an established franchise.
What it showed
Which genre is the most popular in each region?
Action leads in every region except Japan, which prefers RPGs.
| Region | Top Genre | Percent of Sales |
|---|---|---|
| Japan | Role-Playing | 27.4% |
| Other | Action | 23.3% |
| Europe | Action | 21.4% |
| North America | Action | 20.0% |
How do sales relate to critic score, and by how much?
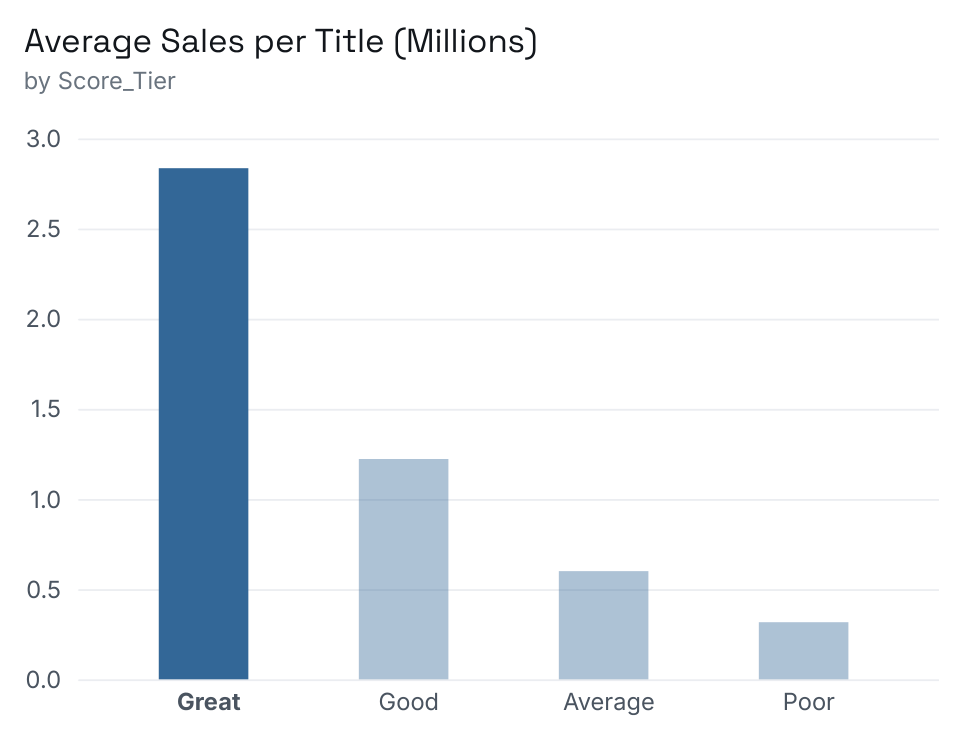
Titles rated “Great”, a critic score of 90 or above, sell best, averaging more than twice as many copies as “Good” titles. From there the decline is steady: the lower the rating, the lower the sales. One caveat: 51% of titles in the dataset have no critic score at all, including many early NES classics, so unrated titles are left out of this comparison.
Which standalone titles compete with or outperform franchises?
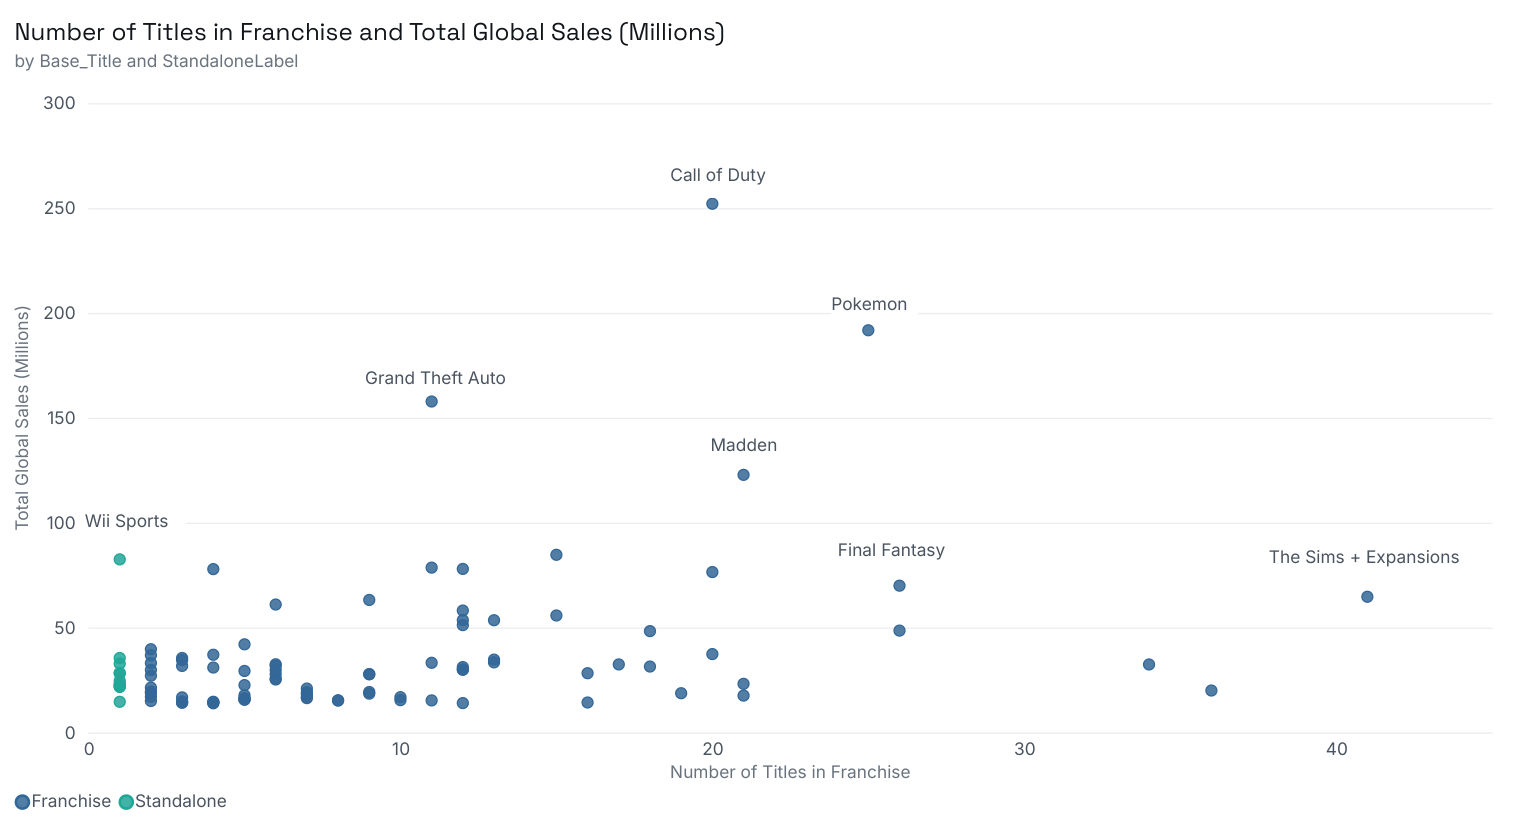
Only one. Wii Sports, still a standalone title when the data was published, is the only non-franchise game whose sales compete with series like Call of Duty and Grand Theft Auto: it sold about a third as much as every Call of Duty title combined, and about 18% more than the entire Final Fantasy franchise. The takeaway: a launch title for a new Nintendo console can become a massive hit when it draws in people who weren’t gaming before.
Project 02 · University Major Payoff
Which college majors actually pay for themselves?
A public Kaggle dataset of 30,000 graduates across 19 majors, each with the net cost of their degree, the debt they took on, ten years of earnings, and whether they interned and finished on time. The records are synthetic, generated rather than drawn from real students, but calibrated to published ROI research from Georgetown’s Center on Education and the Workforce, FREOPP, and the College Scorecard. The questions are the ones a student and their family weigh before choosing a major: which degrees pay off, how much the effort around the degree matters, and how quickly each one pays for itself.
What it showed
Which major has the best return on investment?
Electrical engineering. It has the highest average salary in the set, about $105,000 a year across the first ten years, and returns 759% on the cost of the degree. Engineering, computer science, and business analytics hold the top of the table, and only two majors come out negative on average: humanities and fine arts.
| Major | Avg ROI | Avg Salary |
|---|---|---|
| Electrical Engineering | 759% | $105,063 |
| Business Analytics | 676% | $97,377 |
| Chemical Engineering | 667% | $97,379 |
| Computer Science | 658% | $96,675 |
| Computer Engineering | 641% | $94,172 |
| Economics | 567% | $89,359 |
| Mechanical Engineering | 548% | $87,533 |
| Finance | 453% | $79,838 |
| Nursing | 451% | $80,186 |
| Business | 354% | $71,688 |
| Marketing | 191% | $59,440 |
| Biology | 181% | $58,346 |
| Communications | 98% | $51,726 |
| Criminal Justice | 60% | $48,819 |
| Education | 25% | $45,944 |
| Social Work | 19% | $45,528 |
| Psychology | 14% | $44,983 |
| Humanities | −7% | $43,579 |
| Fine Arts | −40% | $40,885 |
How much do internships and finishing on time change the return?
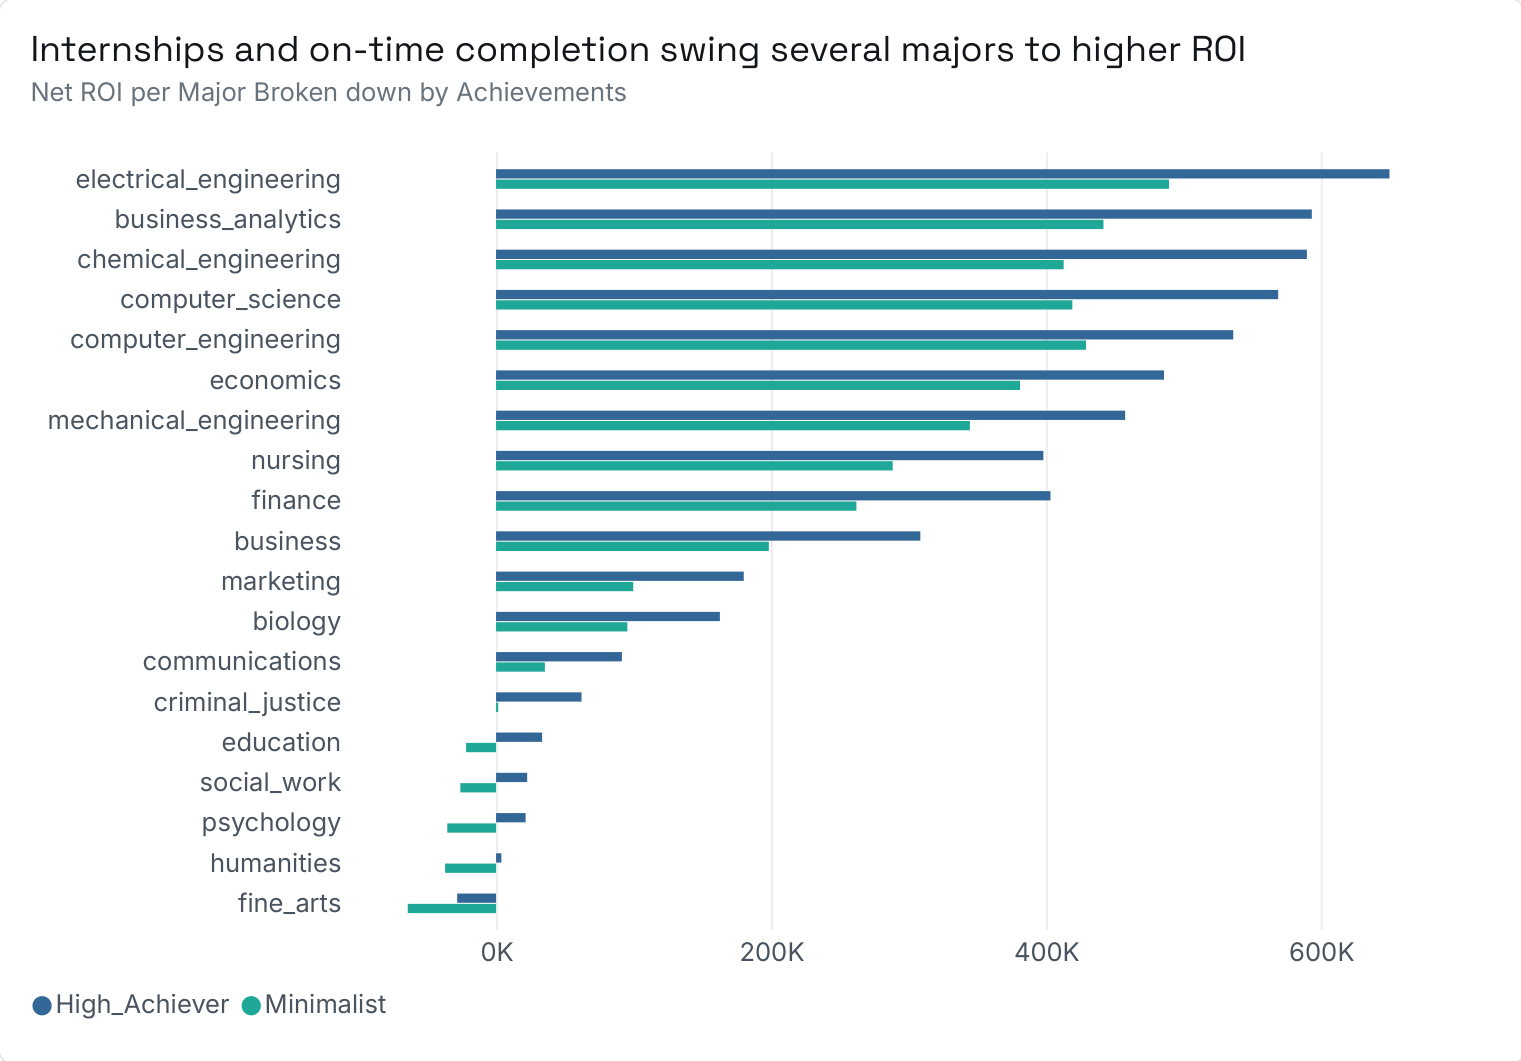
Graduates who did both, the High Achievers, earned a higher return than those who did neither, the Minimalists, in all 19 majors. The gap matters most at the bottom of the table, where it decides whether a degree pays at all: Criminal Justice minimalists roughly broke even, at about $1,600 over ten years, while high achievers in the same major returned over $62,000. Fine arts is the one major the extra effort can’t rescue, still about −$28,000 at best, even though it costs only a few thousand dollars less than an electrical engineering degree.
One caution worth stating: the dataset was generated with internships and on-time completion already raising earnings and lowering cost, so the effect itself is an input rather than a discovery. What the analysis adds is where it is decisive. Near the top of the table it adds to a return that was already large; near the bottom it decides whether the degree pays for itself at all.
Which degrees pay for themselves fastest?
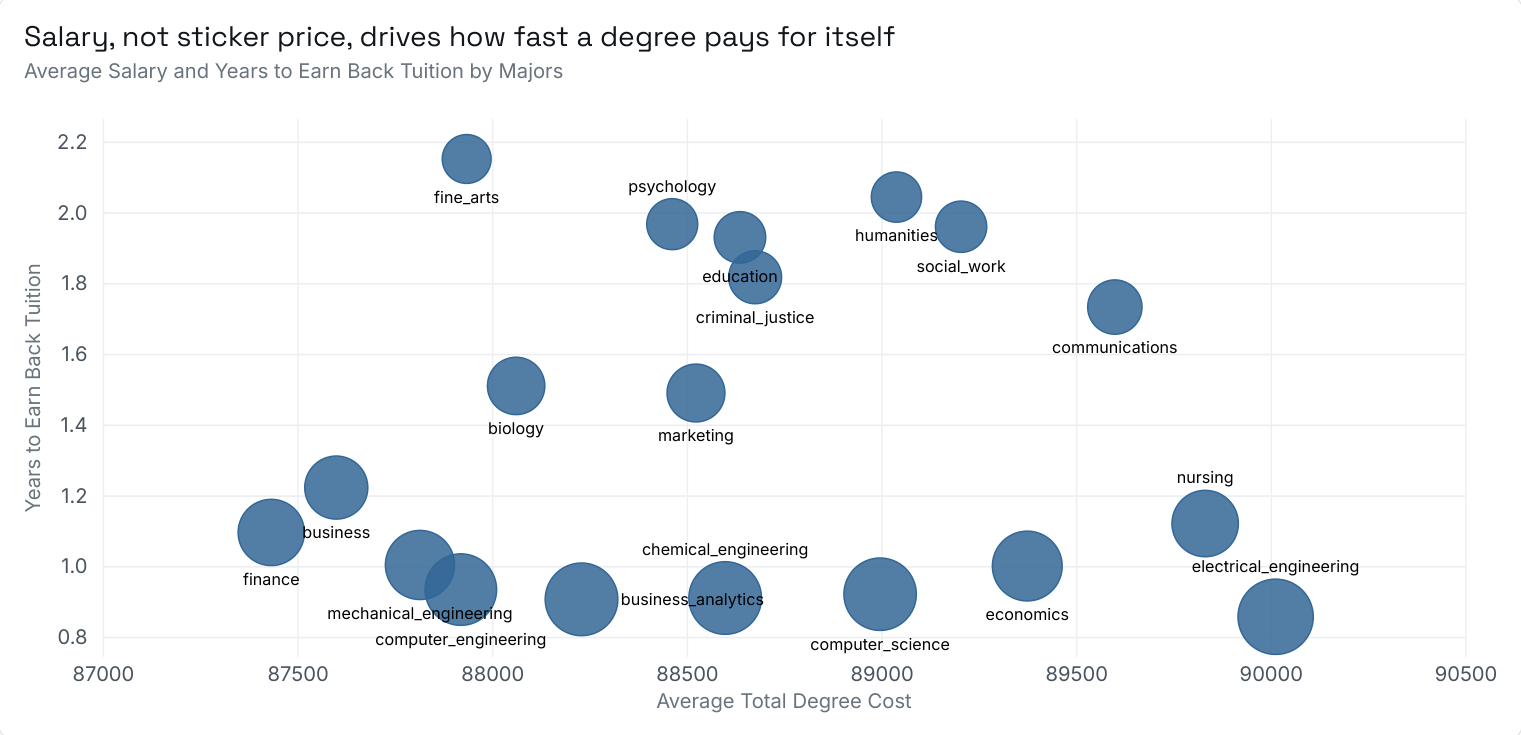
The ones that pay the most. Average cost barely moves from one major to the next, varying by only a few thousand dollars, so how quickly a degree earns back what it cost is set almost entirely by salary. The payback order follows the salary table almost exactly: electrical engineering fastest, fine arts slowest. An electrical engineering degree costs less than one year of its graduates’ average salary; a fine arts degree costs more than two.
What’s next
A third project is likely to join these two. In the meantime, The Invest Lab and Football Forecast are both live.