Football Forecast
An NFL research site where the disagreement with expert consensus is the product: a second opinion for fantasy and game pick decisions.
- Role
- Sole builder
- Stack
- Python, polars, nflverse
- Status
- Live, updated weekly in season
The question
Most fantasy and sports sites will hand you a consensus ranking and relay the standard spreads, but few tell you where their numbers differ from everyone else’s, or why. That difference is the only part that can give you an advantage. If your list matches the crowd, following it gains you nothing, because the price already reflects it.
So the question was: where does a model built on production and situation diverge from the expert consensus, and is that gap explainable? A gap you can’t explain is a bug; a gap you can explain is an edge.
The approach
Almost everything is calculated from public data. nflverse, the open-source project behind nflfastR, supplies play-by-play efficiency (EPA per play), weekly stats, roster and depth-chart snapshots, and real market lines from the same schedule feed. FantasyPros’ consensus rankings serve as the market baseline, and the National Weather Service supplies game-day forecasts. One input is deliberately manual: offensive and defensive coordinator continuity, hand-researched each offseason and cross-checked against independent reporting, because no free feed tracks it. The model also carries a few less conventional signals, such as the “chip on the shoulder” of a team facing its old coach.
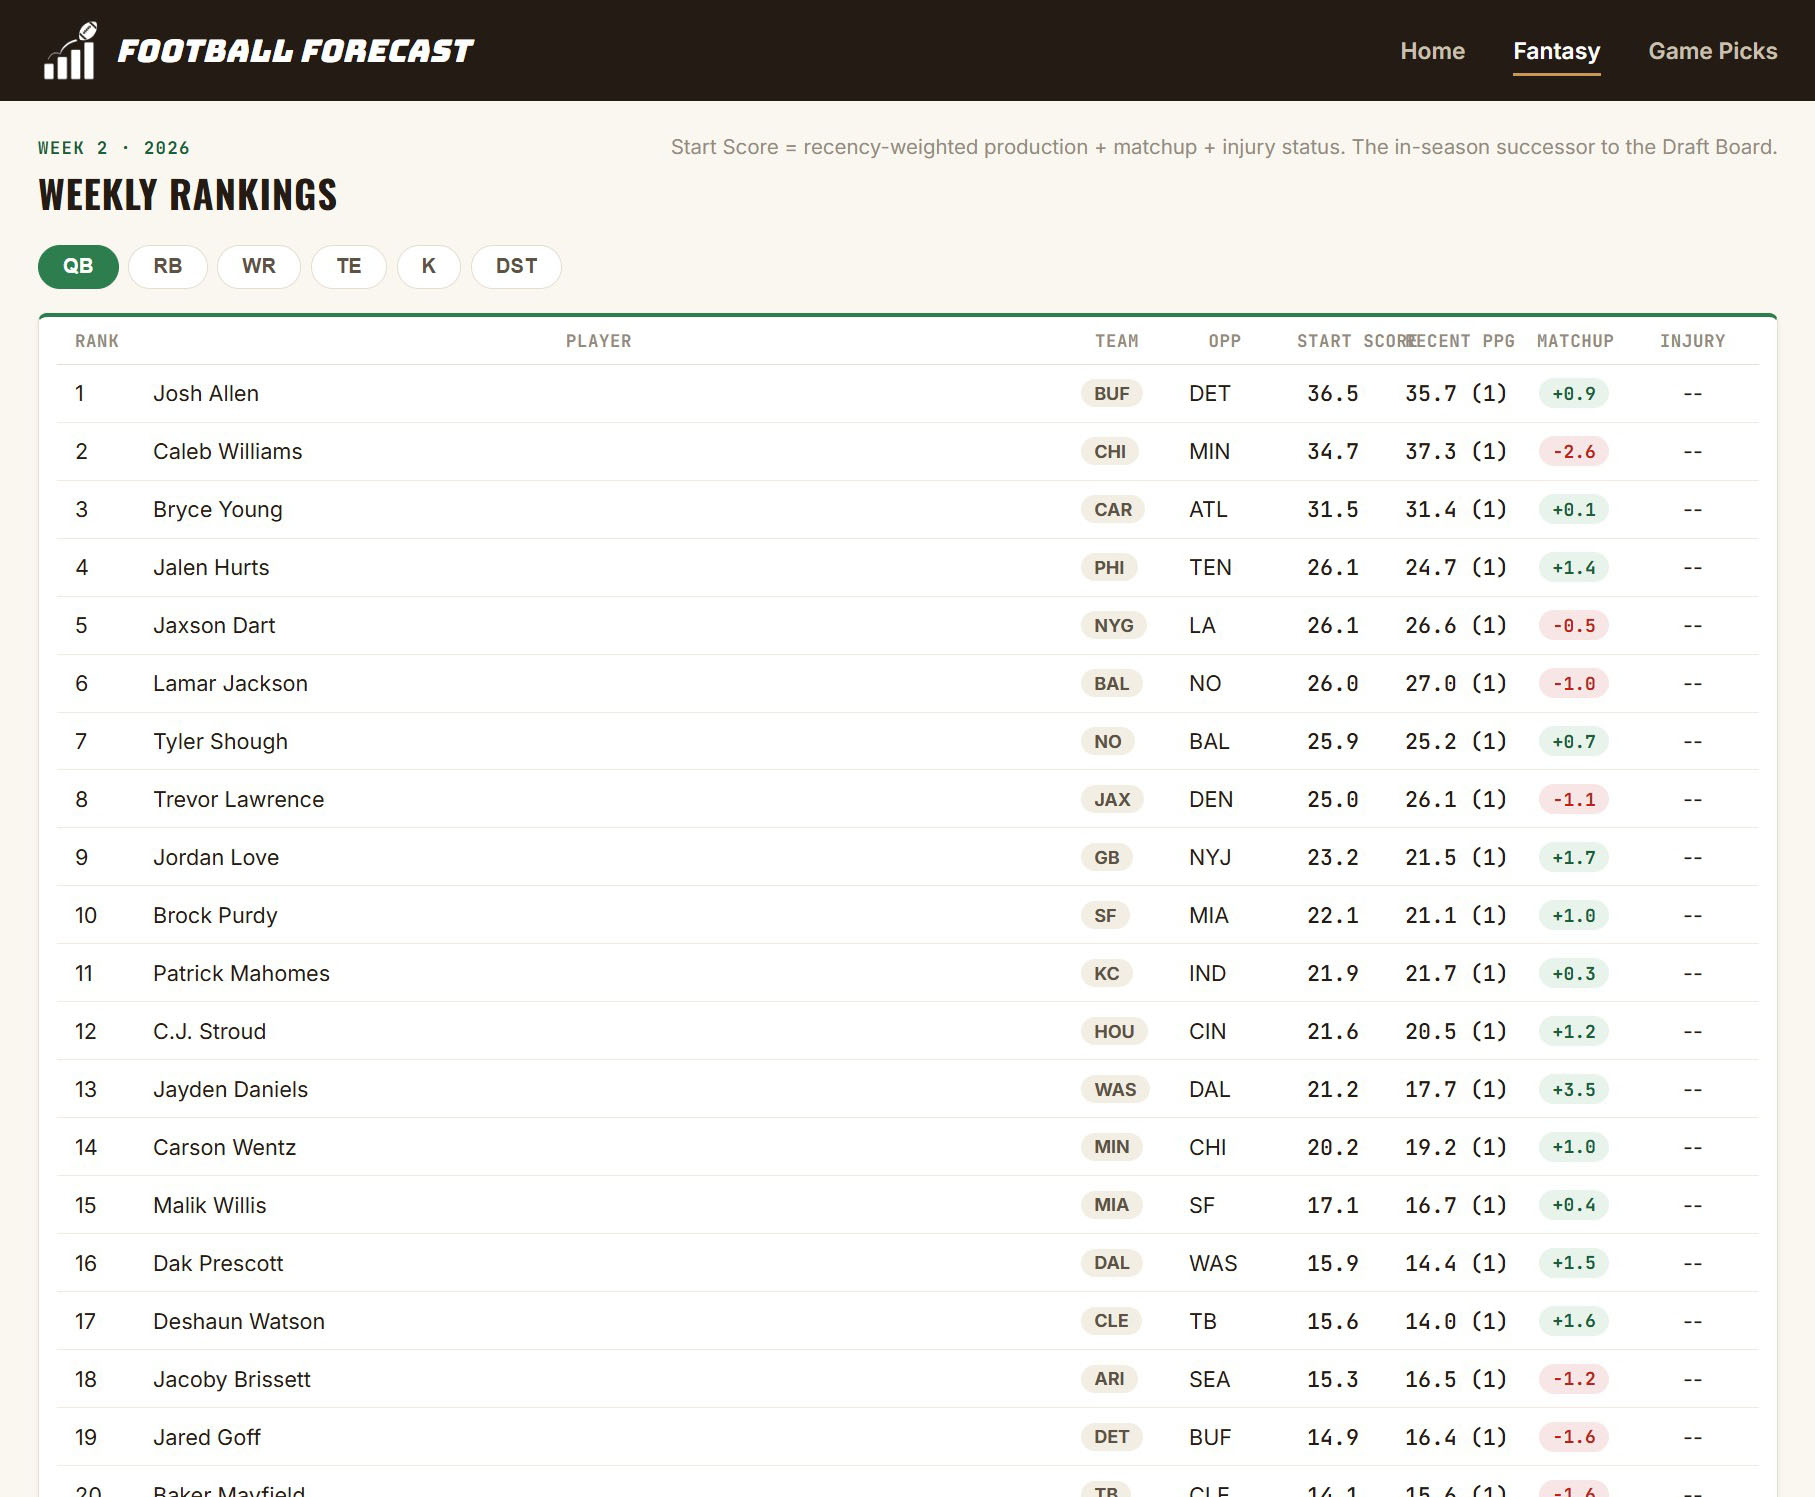
Rankings start from prior production, then adjust for the unglamorous factors that move outcomes more than highlight reels do: offensive and defensive line continuity, head coach and coordinator continuity, and availability. The draft board isn’t a top-10 list but a pick-by-pick snake-draft simulation built on value over replacement, so each player is measured against what you could get instead at the same position.
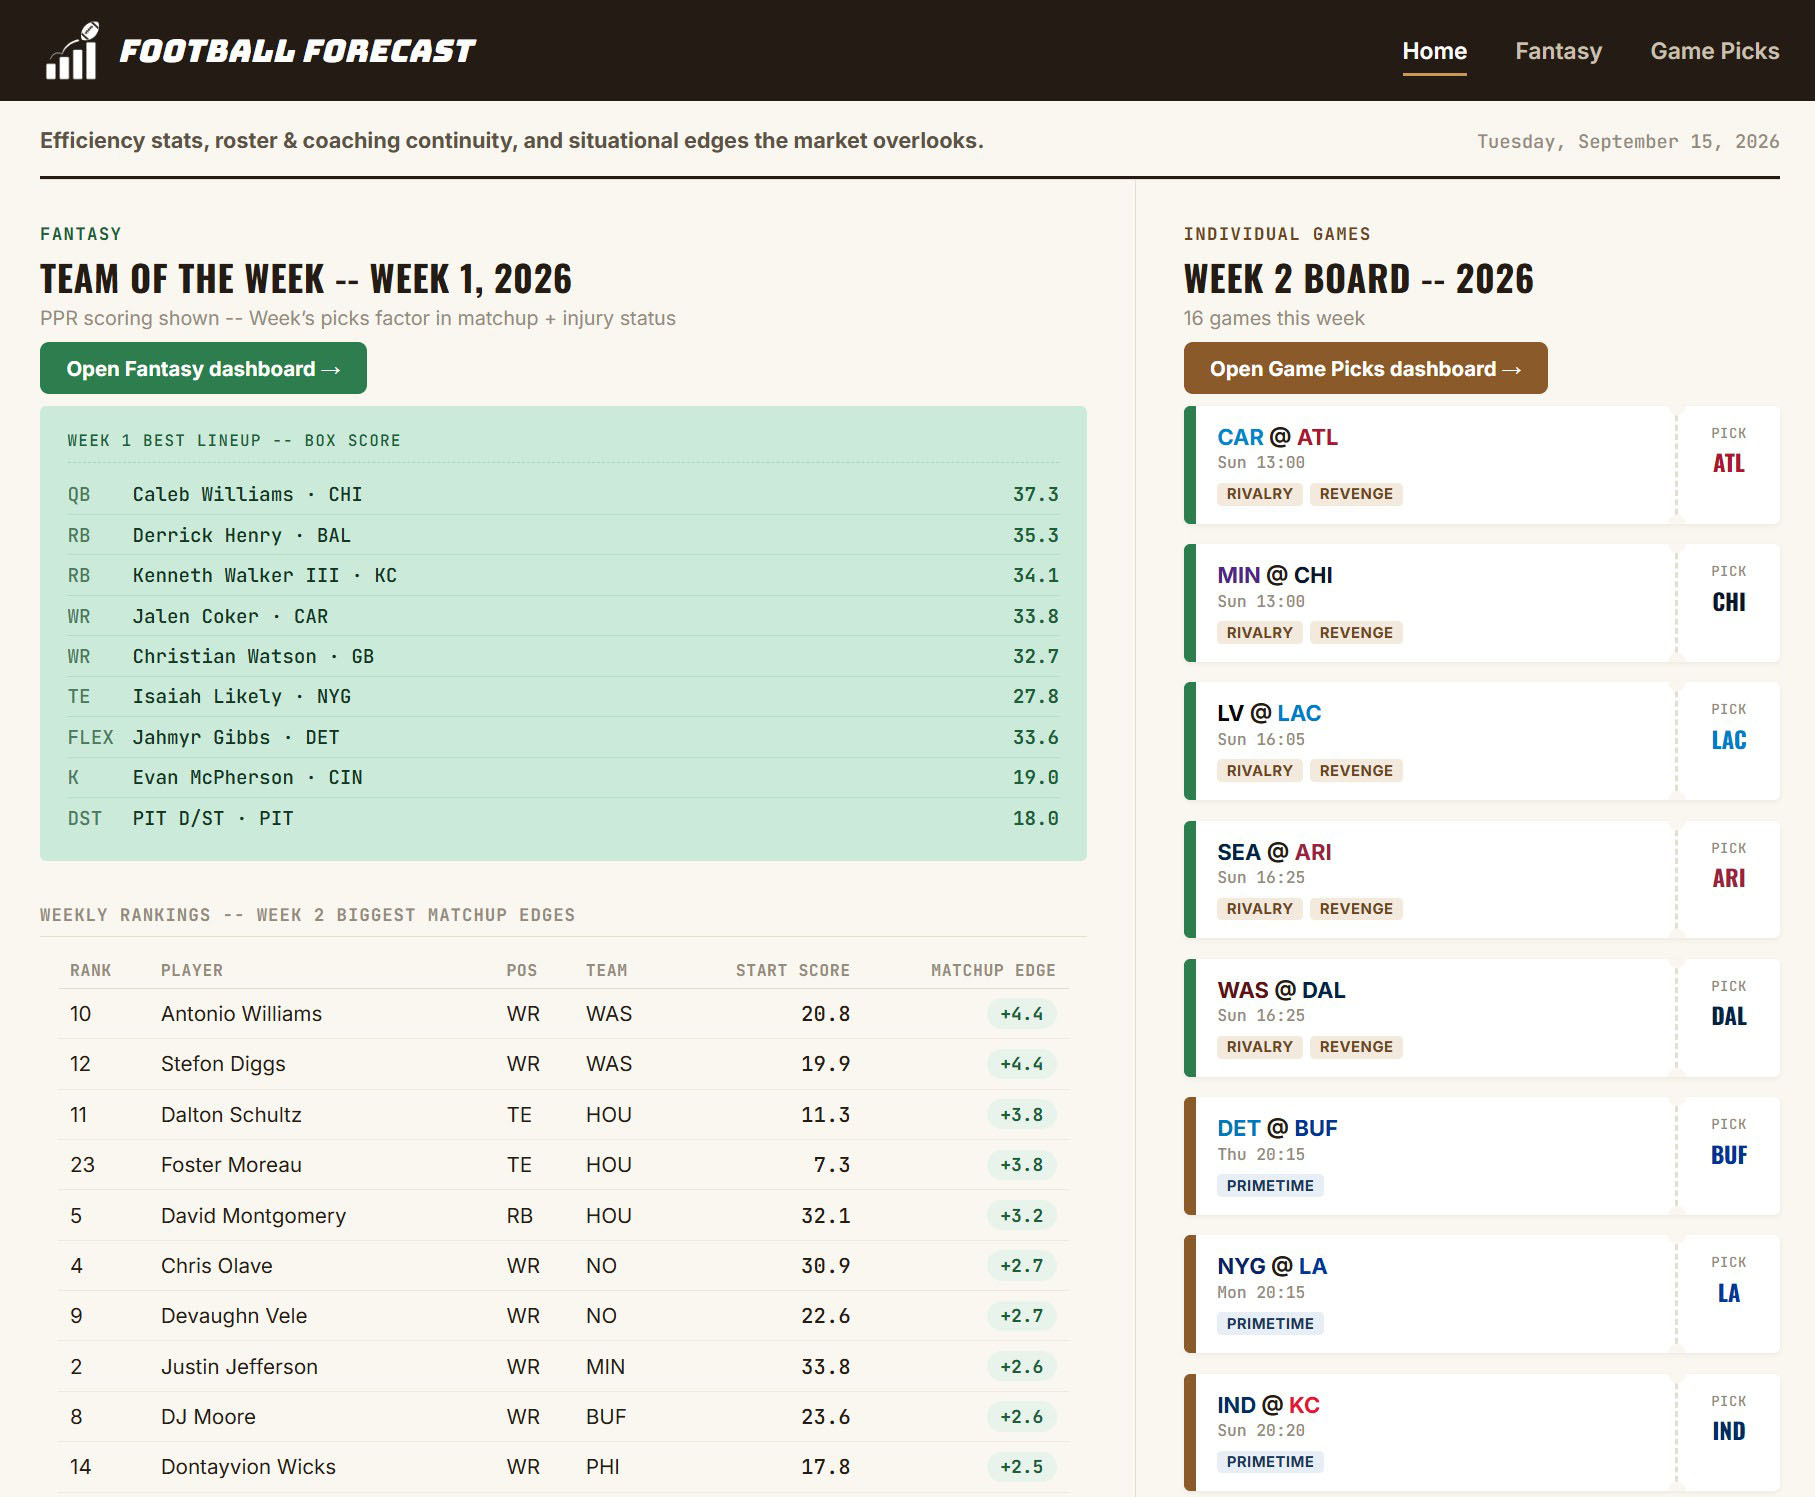
Every projection is then set directly beside the market’s number. On the game pick side the same logic runs in reverse: offense-versus-defense efficiency, rest, rivalry and revenge context, and weather are combined into a plain-English storyline for each game and set against the actual Vegas spread.
What it turned into
The preseason draft board shows the divergence clearly: forty-eight players were graded at least 13 slots above their consensus rank, topping out at an 80-slot gap. In every case the site shows which factor drove the gap, whether that’s a continuity edge, an efficiency signal the counting stats hide, or a role change the consensus hasn’t priced in.
Framing it that way changes what the site is for. It isn’t a replacement for the rankings you already read; it’s a diff against them, a second opinion. And when a gap turns out to be wrong, that’s diagnostic too.
What I'd improve next
The game pick side already keeps score in public. A backtest of the 2025 season, run week by week on games the model hadn’t yet seen, is published on the site, and the numbers are humbling: against the spread its picks landed below 50%, and on straight-up winners it trailed simply taking the Vegas favorite. That is exactly the kind of result worth publishing, because it shows where the model needs work. The fantasy side needs the same treatment. Backfilling a season and reporting how often a +20-slot player actually outproduced their consensus rank would move that claim from plausible to demonstrated, and show which adjustment factors are pulling their weight and which are decoration.
Coordinator continuity is also the one hand-maintained input in an otherwise automated pipeline, which makes it the most likely thing to go quietly stale; it needs a freshness check that fails loudly. And some of the more creative signals are subjective. Does a motivated player, one facing his old team or coming back from injury, actually perform better because of it, or did the opposing defense just have an off day? Those are the questions I keep testing as the model iterates.
In Closing
Football Forecast started as a curiosity: could the habits I was building for data analysis be pointed at fantasy football? The first piece was the draft board, timed for my own league’s draft, a value-over-replacement simulation set beside the expert consensus to see where the two disagreed. Once the season began, weekly rankings took over as its in-season successor, and the same logic was run in reverse on the game pick side, setting the model’s read against the market’s line.
It has less history than The Invest Lab, but the same principle carried over from the start: show the reasoning behind every number, and treat the gap from consensus as the thing worth studying.