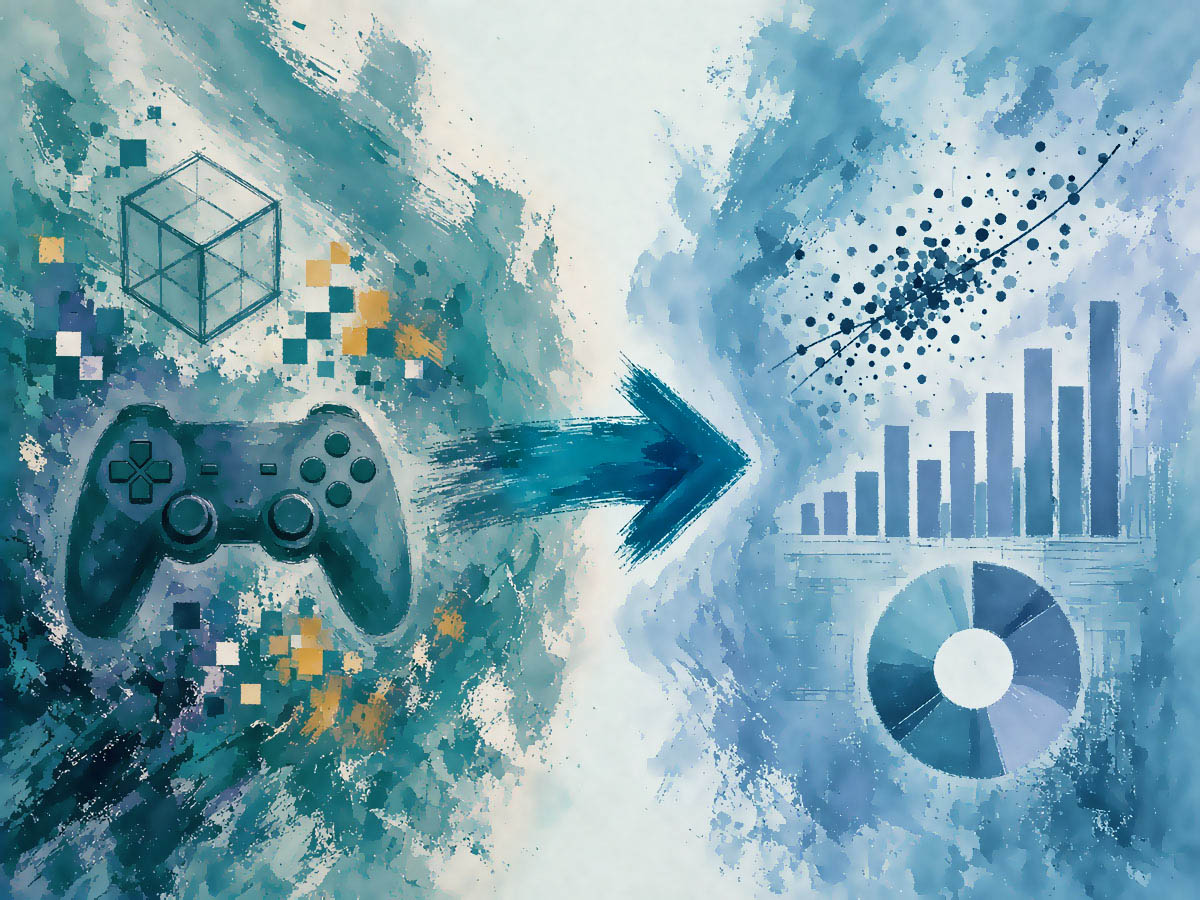
From the graphics pipeline to the data pipeline.
Over two decades building the visuals and technical pipelines for AAA video games, now applied to data analysis. A pivot from 3D art and playtesting levels to SQL and dashboards that turn messy numbers into a clear answer.
Projects
Three case studies
The Invest Lab
Proprietary screens scan the liquid US market on various metrics and surface the names worth a second look.
A live research platform that pulls public data such as price, volume, SEC Form 4 insider filings, and news sentiment daily then scores each ticker through five separate models and publishes the results in an eye-catching format.
Football Forecast
Using player, coaching, and team data in creative ways to break away from the consensus predictions.
An NFL research site built on nflverse play-by-play data to help users make informed fantasy and game pick decisions. Rankings adjust for the unorthodox factors that move outcomes, then get set beside the market's own number.
About

For 20 years, I built the visual and technical pipelines behind AAA video games and helped ship six award-winning titles played by millions of players, including Forza Motorsport, The Elder Scrolls Online, and Star Wars: The Old Republic. My role sat at the intersection of artist and systems thinker, developing shader pipelines, technical art standards, and material libraries used across entire studios.
Communication has always been part of the job. At Microsoft, I regularly presented work directly to senior leadership, including the highest levels of the Xbox org, and gave recurring presentations across the studio, translating deeply technical work into something both leadership and non-technical stakeholders could act on.
I'm now applying that same pattern recognition, systems thinking, and communication instinct to data, with the goal of becoming an analyst. I'm currently completing DataCamp's Associate Data Analyst certificate.
Skills and Toolkit
Decades of technical art work built habits that carry over directly to data. An eye trained on 3D modeling, shader development, and texture and material work helps shape how I build the visuals for data storytelling.
Experience communicating complex data ideas and workflows to diverse audiences has strengthened my ability to distill information into clear, actionable narratives.
Data & analysis
AI Proficiency and Additional Skills
From 20 years in games & art
Contact

Feel free to reach out, I'm happy to talk about the career pivot, the projects, or data in general. My profiles are linked below, let's connect!