Blog · Data Visualization
Same data, two charts: a before-and-after in data storytelling.
- Published
- Topic
- Chart design
- Read
- 5 min
The Aspen Institute’s Project Play recently released its latest State of Play numbers on youth sports: the share of kids aged 6 to 12 who play each sport on a regular basis, and how that has shifted over the years. Reading through the coverage, I ran into the same figures twice, drawn two very different ways.
I’m currently reading Storytelling with Data by Cole Nussbaumer Knaflic, and the pair landed as a near-perfect before-and-after example from the book on how to make data tell a story. Same survey, same numbers, and one version makes you work for the story while the other hands it to you in about three seconds. It’s worth looking at why.
The before
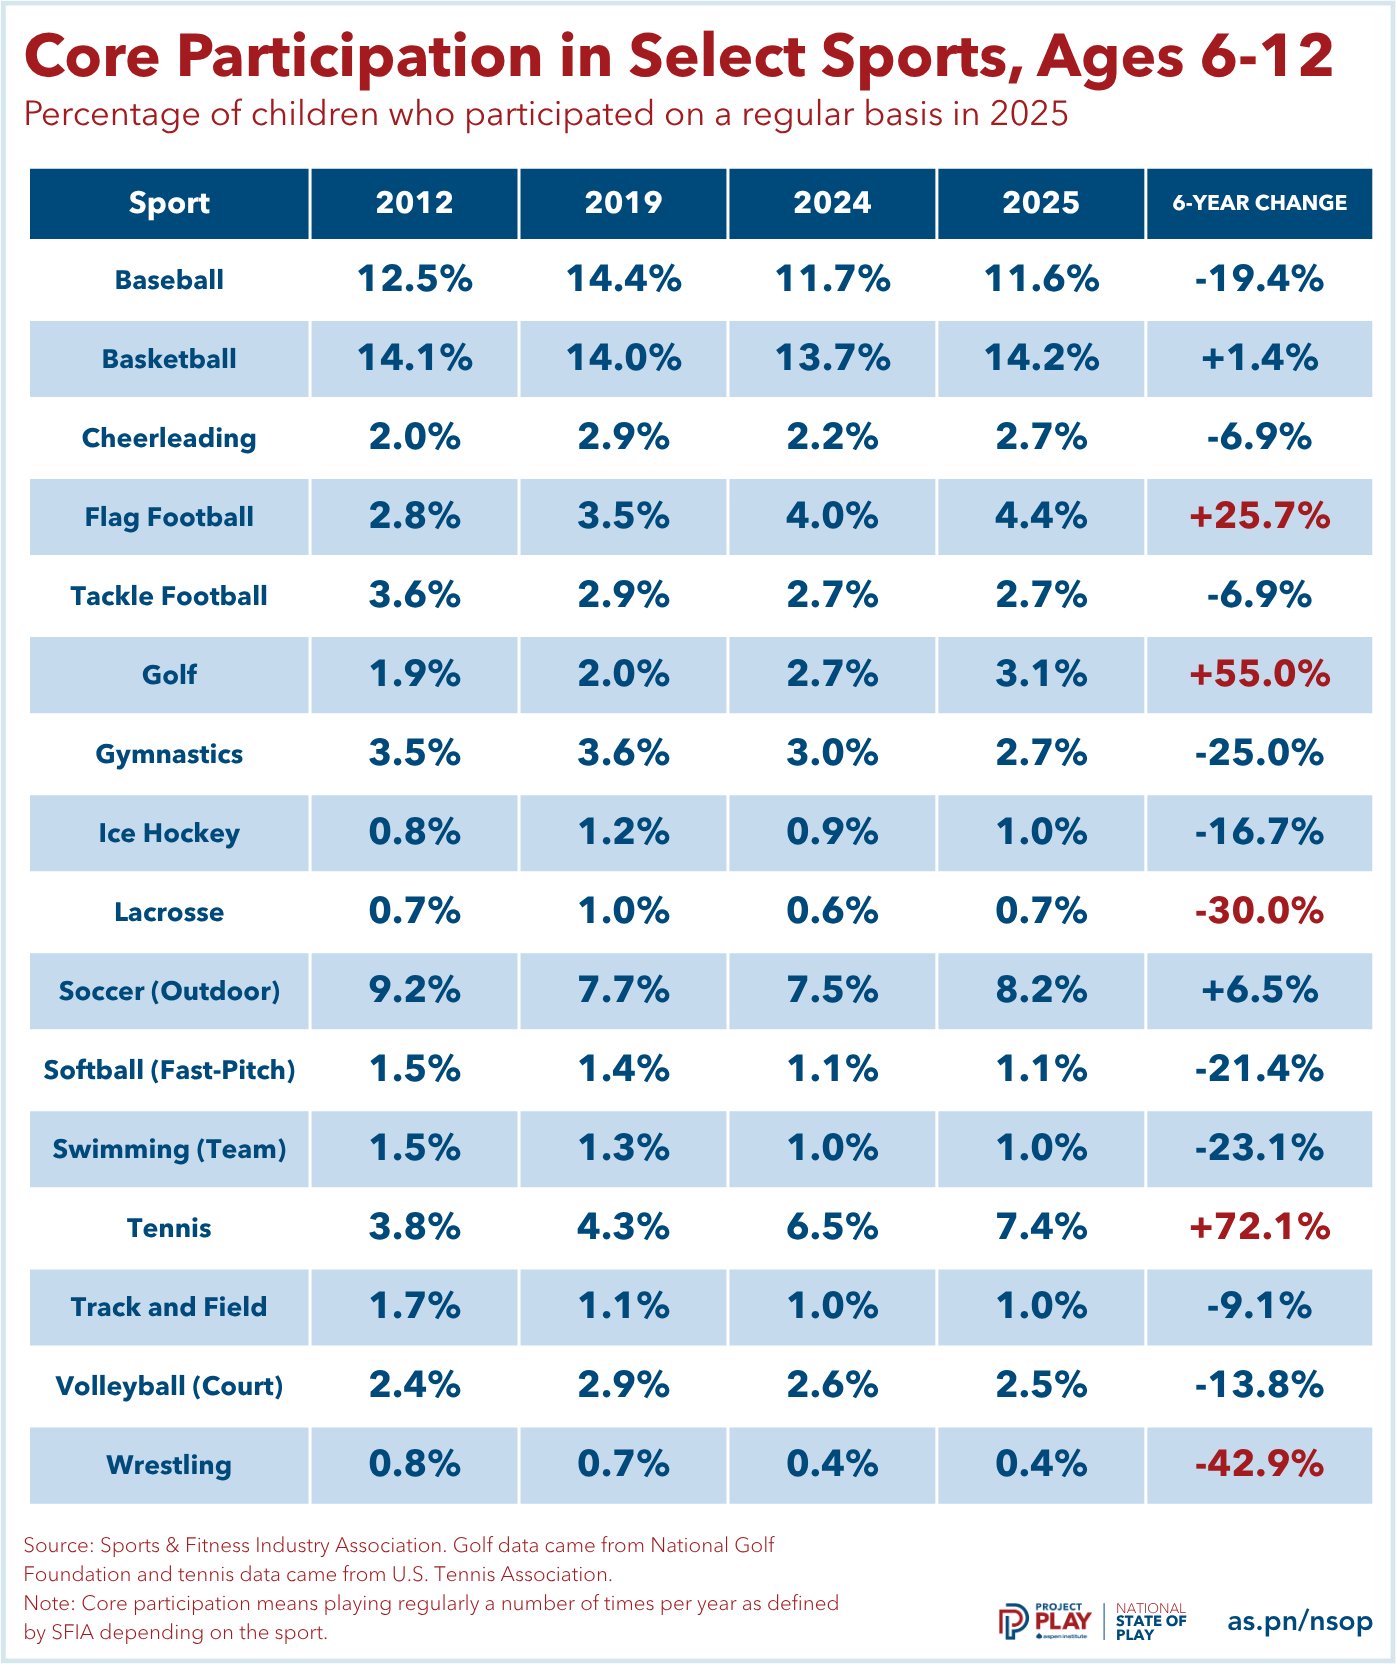
Here is the original, as published with the report. Take five seconds with it and try to say what happened.
Why it’s hard to read
Every number in it is accurate. The problem is that it presents eighty values with equal weight and leaves the analysis to the reader.
- The title is a label, not a finding. “Core Participation in Select Sports, Ages 6-12” tells you what the table contains, not what it shows.
- Alphabetical order answers a question nobody asked. To find the biggest gain or the steepest drop, you have to scan all sixteen rows and compare them in your head.
- The one color cue is ambiguous. Red marks tennis at +72.1% and wrestling at −42.9% alike. Most readers take red to mean “down,” but here it means “big, in either direction.”
- Half the columns don’t feed the headline number. The change column compares 2019 with 2025, but 2012 and 2024 sit in between, so the reader has to work out which two columns it was calculated from. The subtitle says “in 2025” over a table that spans thirteen years.
- Everything is emphasized, so nothing is. Every value is set in the same heavy bold, inside a dark header bar and full-width row stripes. That ink competes with the data instead of guiding you through it.
The after
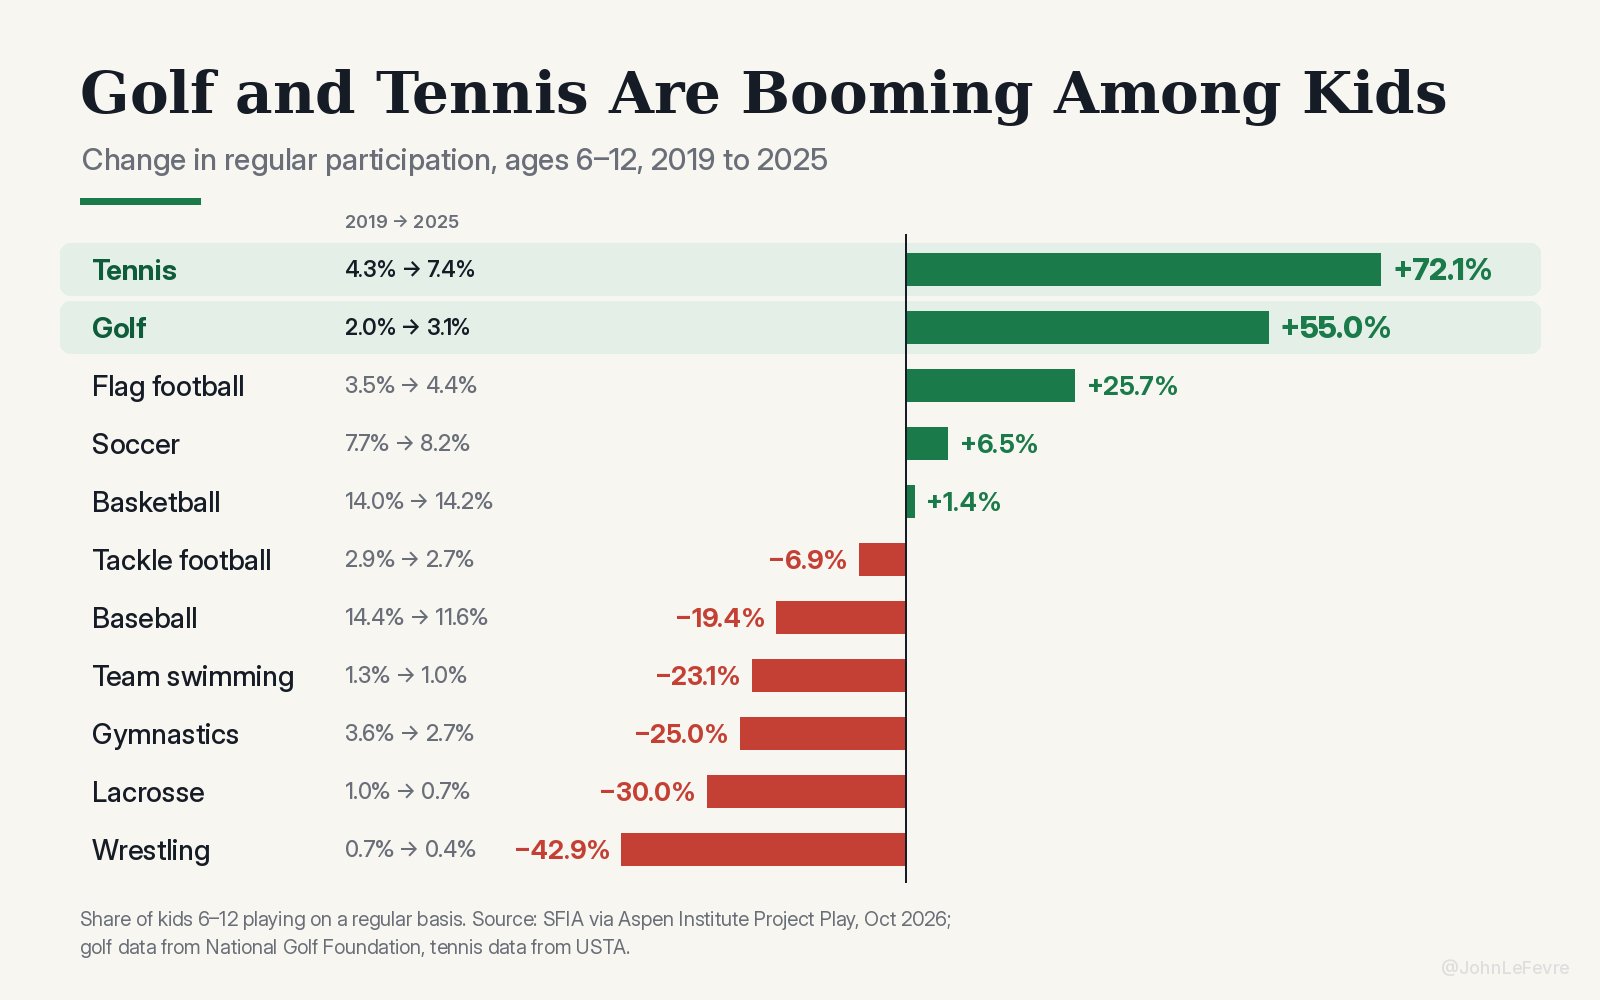
Now the same survey, redrawn by someone else in a post of their own.
Why it works
I checked it against the table: every percentage matches. Nothing about the data changed, only the decisions about how to show it.
- The title is the finding. “Golf and Tennis Are Booming Among Kids” tells you the story before you read a single bar, and the chart then proves it.
- It’s sorted by the thing being compared. Biggest gains at the top, steepest drops at the bottom, so the ranking is the shape of the chart.
- Color has one job. Green is up, red is down. The only other emphasis is a pale band behind the two sports the title is about.
- It shows one comparison and keeps the context. Only 2019 and 2025 appear, the same span as the change, and each sport’s starting and ending share is printed beside its name, so a +72% bar still reads as 4.3% of kids becoming 7.4%.
- Bar length does the comparing. The eye judges length far faster than it compares numbers in a grid. Labels sit right at the end of each bar, with no gridlines, axis or borders to decode.
What the clean version leaves out
A clear chart is still an edited one, and reading it like an analyst means asking what was cut. Three things stood out when I set the two side by side.
Five sports are missing, and all five declined. Cheerleading, ice hockey, fast-pitch softball, track and field, and court volleyball fell between 6.9% and 21.4%, and none of them made the redraw. In the chart, six of eleven sports are down; in the full table it is eleven of sixteen. The decline is broader than the chart suggests.
Percent change exaggerates small sports. Wrestling’s −42.9% is a move from 0.7% of kids to 0.4%, three tenths of a percentage point. In points, tennis gained 3.1 and baseball lost 2.8, nearly a mirror image, even though the bars make tennis look like the far bigger story. The printed start and end values are what keep the chart honest here, and they’re the detail I’d most want to keep in a redraw of my own.
The two headline sports are measured differently. Both charts footnote that golf figures come from the National Golf Foundation and tennis from the USTA, while every other sport comes from the SFIA survey. That doesn’t make the finding wrong, but it’s the first thing I’d check before building on it.
What I’m taking from it
The table isn’t a bad table, it just does a better job at being a reference point as opposed to a storyteller. These are the habits I’m carrying into my own dashboards:
- Write the title as the conclusion, not a description of the data.
- Sort by the value you want compared, never by name.
- Give color a single meaning, and use emphasis sparingly so it still means something.
- Show the one comparison the story is about, and keep the base values visible beside any percent change.
- Remove every line, box and shade that isn’t data, then check what the edit left out.
Twenty years of art direction taught me that where the eye lands first is a decision, not an accident. It turns out charts work the same way.
Sources
Participation data: Sports & Fitness Industry Association, published in the Aspen Institute Project Play’s State of Play report; golf figures from the National Golf Foundation, tennis from the U.S. Tennis Association. Both charts are reproduced here for commentary and belong to their creators.